

Performance
Russell 1000 Value Index measures the performance of the large-cap value segment of the U.S. equity universe. It includes those Russell 1000 companies with lower price-to-book ratios and lower expected and historical growth rates. S&P 500 Index is a stock market index tracking the performance of 500 large companies listed on stock exchanges in the United States. It is one of the most commonly followed equity indices.
The performance data quoted represents past performance; past performance does not guarantee future results. The investment return and principal value of an investment in the Fund will fluctuate so that an investor’s shares, when redeemed, may be worth more or less than their original cost. Current performance of the Fund may be lower or higher than the performance quoted. Performance data current to the most recent month end may be obtained by calling (888) 484-5766.
Fees
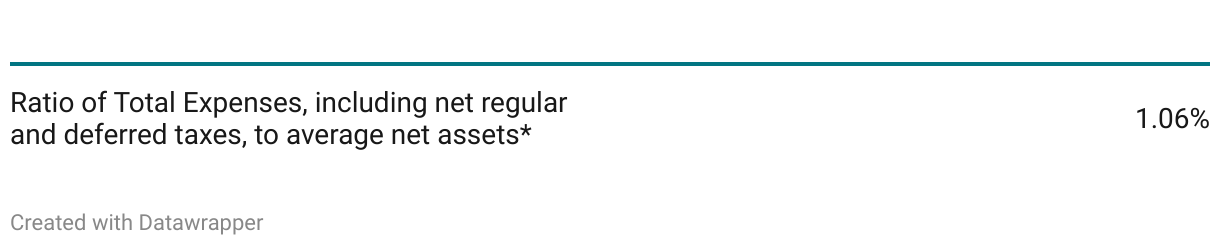
DCM Advisors, LLC (the “Advisor”) entered into an Expense Limitation Agreement with the DCM/INNOVA Fund under which it has contractually agreed to reduce the amount of the investment advisory fees to be paid to the Advisor by the DCM/INNOVA Fund and to assume other expenses of the DCM/INNOVA Fund, if necessary, in an amount that limits the DCM/INNOVA Fund’s annual operating expenses to not more than 1.50% of the average daily net assets of the DCM/INNOVA Fund for the period ending December 31, 2023. The Expense Limitation Agreement may not be terminated prior to that date without the approval of the Board of Trustees (the “Board” or “Trustees”) of Centaur Mutual Funds Trust (the “Trust")
Portfolio Stats
Risk Measures
Standard Deviation measures the average a return series deviates from its mean. It is often used as a measure of risk. When a fund has high standard deviation, the predicted range of performance implies greater volatility.
Beta is a measure of the volatility, or systematic risk of a security or a portfolio in comparison to the market as a whole.
Max Drawdown
Downside Capture
Downside Capture measures a manager’s performance in down markets relative to the market.
Top 10 Holdings
Sector Breakdown
Top 5 Quarterly Contributors
Top 5 Quarterly Detractors
Distributions
The fund has no distributions